Investing in property, crypto, stocks or ETFs?This is your desk.
Every figure dated, every source named, no predictions. One desk covering the lot, refreshed nightly, live by 6am Perth.
Straight off the desk.
Five snips from one real session on the live product. Nothing staged, nothing mocked up.
Real product · recorded 7 Aug 2026 · unedited screenshots
Built to be checked, not believed.
Most dashboards style everything to look live. This one labels what each number actually is, and the labels are enforced in code. Every quote below is lifted straight from the product source.
LIVELIVE means fetched, this session, from a real source
A cyan LIVE chip appears only on figures pulled from a real external source. Numbers derived by the AI carry a separate amber label; the two are never allowed to blur. Meaning is carried by the visible word, not just the colour.
LiveChip: "data fetched from a real source". AiEstimateChip: "derived by the AI… Not a cited institutional figure."
Real fallbacksFallbacks are real, dated figures, never invented
When a live scrape fails, the dashboard shows the last real known value with its date. The ASX 200 P/E seed is a real dated Market Index reading; the rents fallback is the last real SQM figure.
"The fallback is NEVER fabricated." · "the card always shows the REAL last-known number (never a fake)."
Stale says soStaleness is measured, shown, and alarmed on
Every snapshot's age is checked against its section's expected cadence. Fresh, stale or unknown, and unknown renders a plain dash rather than implying confidence. A daily health job emails the operator if any feed silently freezes.
"unknown — no snapshot / unparseable timestamp → render '—', NEVER imply freshness we can't measure."
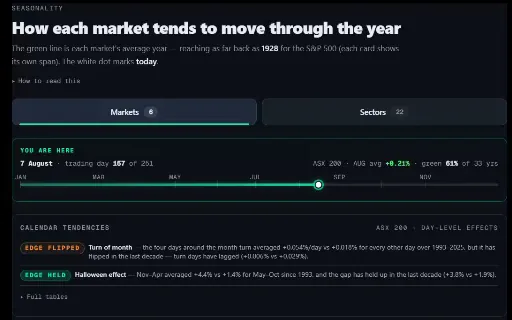
Try it. This is the live module.
The same seasonality instrument subscribers use, running on the real shipped data.
Today's marker is a weekday-count calendar approximation.
Average cumulative return by trading day — averaging 1993–2025 (33 years)
Yahoo Finance ^AXJO (daily) · 1993–2025 (33 yrs) · price return, ex-dividends
| Month | Average return | Win rate | Years |
|---|---|---|---|
| Jan | +0.61% | 61% | 33 |
| Feb | +0.29% | 58% | 33 |
| Mar | −0.26% | 52% | 33 |
| Apr | +1.99% | 73% | 33 |
| May | −0.46% | 58% | 33 |
| Jun | −0.05% | 52% | 33 |
| Jul | +1.70% | 73% | 33 |
| Aug | +0.21% | 61% | 33 |
| Sep | −0.88% | 42% | 33 |
| Oct | +0.89% | 64% | 33 |
| Nov | +0.43% | 64% | 33 |
| Dec | +1.62% | 73% | 33 |
Every valuation lens, one screen
Shiller CAPE, PEG, the Buffett indicator and the ASX anchor, each figure dated to the day it was captured.
The housing cycle, state by state
An AI-composed daily read of Australian housing: cycle position, state momentum and mortgage stress.
- Six states ranked on year on year price momentum
- Rebuilt each morning by the desk's AI scan, and labelled as AI on the panel
AI “Perth leading nation with 19.2% YoY gain but showing early signs of softening in some suburbs”
AI Top risk: “APRA's February 2026 DTI limits cooling investor demand while RBA holds cash rate at 4.35%”
ETF flow figures not in this capture.
| Coin | vs BTC | RS bar |
|---|---|---|
| UNIUniswap | +25.1% | |
| ONDOOndo | +10.8% | |
| ZECZcash | +10.1% | |
| XMRMonero | +9.9% | |
| SHIBShiba Inu | +8.6% |
| Coin | vs BTC | RS bar |
|---|---|---|
| CCCanton | -27.1% | |
| HYPEHyperliquid | -23.3% | |
| XLMStellar | -20.0% | |
| GRAMGram | -19.9% | |
| RAINRain | -18.9% |
The coins outrunning Bitcoin
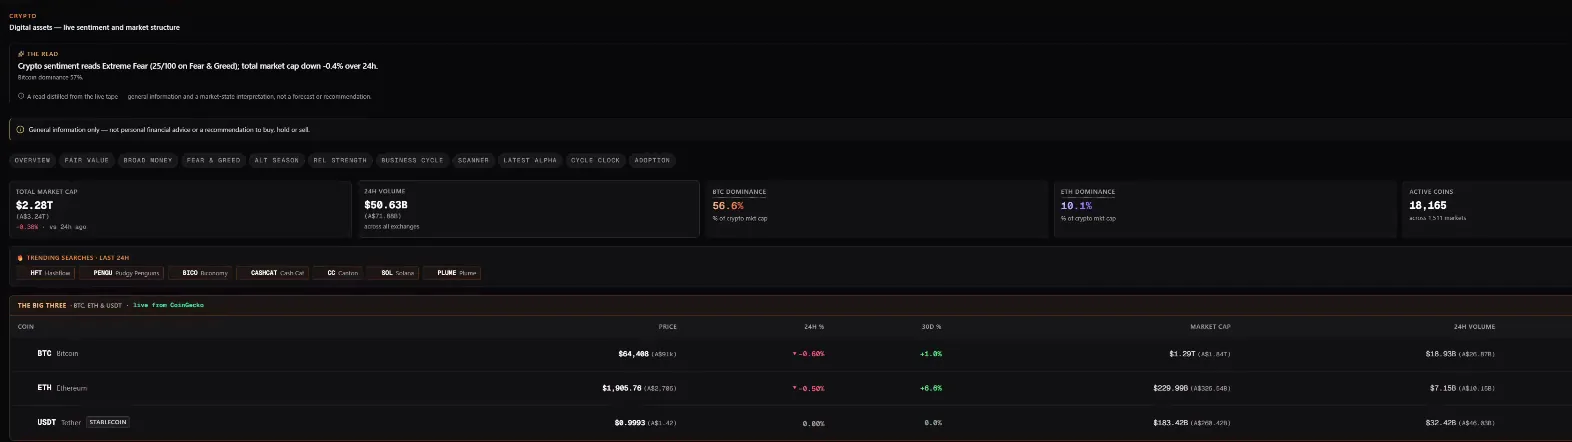
Market cap, dominance and fear and greed, plus a live leaderboard of coins beating Bitcoin over 30 days.
- Track the tokens beating BTC without opening ten tabs. The leaderboard ranks every top-50 coin against Bitcoin over 30 days, stablecoins stripped out.
- No AI in the loop on this module. Every number is straight market data, refreshed on schedule.
- Crypto fear and greed logged daily beside the tape, so you can watch the mood turn.
The US moves, the ASX lags
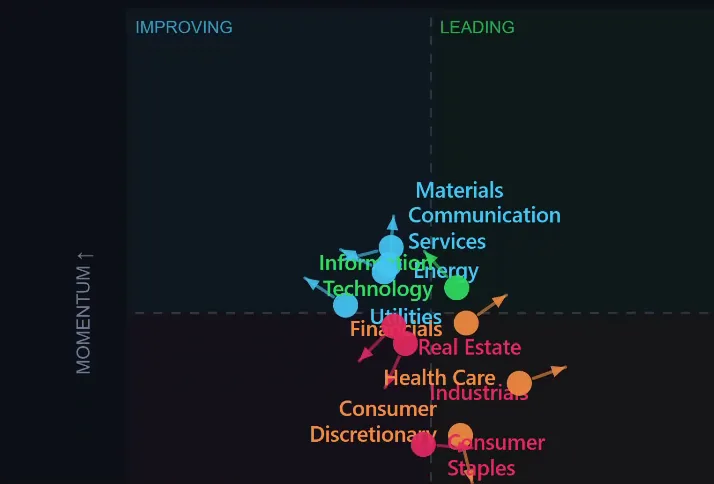
See which US sector moves have already reached the ASX and which are still an open gap.
Top 3 US sectors with the strongest signal
AIas-of month April 2026Which Australian sectors have caught up to the US, and which haven’t
AIARRIVED = US move already priced in. PARTIAL = half-way. FORMING = the ASX response is starting to form. NOT YET = US has moved, ASX hasn’t. That is the open gap.
Each node sits at that row’s US to ASX correlation on the 0 to 1 scale above. Dashed lines show the US signal travelling to its ASX counterpart.
What moved markets this week
Scored wire stories, emerging tickers and an AI weekly brief. The headlines moving markets without the hours.
“Middle East energy disruption lifts near-term Australian LNG and thermal coal forecasts while iron ore begins multi-year fade from peak earnings”
Resource export earnings hit $422B peak on Middle East energy disruption
LNG earnings surge 27% to $70B in 2026-27 on strait blockages
Watch what big money does
Fund manager exposure, retail sentiment, fear and greed, and the latest insider filings. Primary sources, every input dated.
The desk pulls the NAAIM manager survey, the AAII retail survey, CNN's Fear and Greed index and the latest SEC Form 4 insider filings straight from the primary source. Each reading lands with its own survey or filing date, so you can see when managers lean one way and the herd leans the other. No LLM in the loop on this module.
- Primary surveys: NAAIM manager exposure and AAII retail bull-bear.
- CNN Fear and Greed captured with its exact as-of time.
- Insider buy and sell tape read from real SEC Form 4 filings.
- The washout dial is computed in-product from these dated inputs.
Tightness scored, tickers attached
The desk scores supply and demand tightness across the commodity universe, ranks the squeeze, and maps it straight to ASX names.
Five structural filters sit behind every score: capex starvation, demand inflection, supply concentration, lead time and substitution. Deficit timing and narrative saturation ride alongside, so tightness is visible before the crowd names it.
Rings fill to the composite score, bars to the supply and demand subscores, both on labelled 0 to 10 scales.
- 01UraniumNarrative FormingDeficit Now5/5 Filters
“All 5 structural filters pass, narrative forming but far from crowded, utility contracting cycle just beginning”
S 9 · D 9 - 02CopperNarrative EmergingDeficit 2026+4/5 Filters
“Strongest secular demand story, 15-year capex starvation, grid + EV + AI converging”
S 9 · D 8 - 03TinNarrative EmptyDeficit Now4/5 Filters
“Best risk/reward for contrarians — structural tightness with zero retail interest”
S 9 · D 7 - 04SilverNarrative EmptyDeficit Now3/5 Filters
“Fifth consecutive deficit year, industrial demand inflecting, sentiment neutral”
S 8 · D 9 - 05PlatinumNarrative EmptyDeficit Widening3/5 Filters
“Deep contrarian play on hydrogen + autocatalyst pivot, supply collapsing”
S 8 · D 7
“Boss Energy — Honeymoon restart producing, cash-flow positive at current spot”
“Paladin Energy — Langer Heinrich ramping, higher-beta operational leverage”
“Deep Yellow — Tumas development, torque to funding environment”
TSX/NYSE producer (CCJ) and ETP (URNM (US)) routes are listed on the same setup.
“Boss Energy — ASX uranium producer with leverage to contract repricing”
“Spot at $95/lb, term at $91.50/lb per Cameco Q1 2026 filings. Utility contracting 2024-2026 cohort replacing legacy $35/lb contracts.…”
“Sprott Physical Uranium Trust redemption event or utility contracting pause would puncture spot — spot is thin and sentiment-driven in the short run, even as term fundamentals stay intact.…”
The rest of the desk
Everything else the desk carries, at a glance: seasonal history, ten Australian money tools and the morning AI read.
ASX and US sectors side by side. Each chart renders full history or the last 10 years.
2 ASX sectors historically firm in August
- Capital Gains Tax
- Franking Credits
- Position Sizing
- Watchlist
- My Stocks
- My Properties
- Rental Yield
- Negative Gearing
- Stamp Duty
- Super Fund Comparison
Ten tools for the Australian side of your money. Calculators and trackers saved locally in your browser.
“Risk-on holding: curves steep, credit calm, crypto greedy at 71, insider selling heavy.”
One grounded sentence over the desk's live feeds, rewritten every morning.
Type any theme and the Research Terminal maps its full value chain, layer by layer, to the constraint that matters.
One price. No tiers, no lock-in.
One subscription. The entire dashboard: morning macro brief, every section, every calculator, and the AI Research Terminal.
One desk for property, crypto, stocks and ETFs.
- Morning macro brief, refreshed nightly
- Housing cycle, rotation, valuation and recession risk
- News and signal, positioning, commodities
- Crypto dashboard and sentiment scanner, no LLM in the loop
- AU calculator toolkit: CGT, franking, gearing, super
- AI Research Terminal: 5 live searches per week
- Live market tapes updated through the day
Secure checkout via Stripe: card details are entered on Stripe's hosted page and never touch the Macro Command Centre server. Renews monthly; cancel anytime from the Billing page, no email or phone call needed. Access continues to the end of the paid period; no partial-period refunds. All prices in AUD; a receipt is emailed after each payment.
General information only, not personal financial advice or a recommendation to buy, hold or sell.